Data visualizations
New tools permit custom analysis of educational attainment results
Most recent U.S. Dept. of Education data made "slice-able" by grade, subject, and demographic variables.
New interactive tool puts tax rates into historical context
As Tax Day looms — and as Obama and GOP compete to cut tax rates — new tool helps make clear who has had to pay what since 1945.
"Good" jobs to be had in big-growth occupations?
Government projections show 44 occupations that will grow by 100,000 or more jobs. Seven of the top 10 pay under $35,000.
Former lobbyists serving as top staffers on Congressional committees
First look at dozens of senior committee staff members who used to be lobbyists.
The revolving door: ex-lobbyists now working for Congress
Current Chiefs-of-Staff and Legislative Directors who have one or more lobbying jobs in their past.
Tracking where displaced top Congressional staffers have migrated
Data viz tracks new employers and positions.
Visits to the Emergency Room: Bush-care, Canada-care, and UK-care compared
As Congressional Republicans do their best to repeal "Obama-care," Remapping Debate revisits how "Bush-care" stacked up on the rate of ER visits.
Where are those newly out-of-office Members of Congress going?
Remapping Debate and the Center for Responsive Politics team up to find out.
New data on gender segregation and pay disparities in jobs
Remapping Debate's analysis of latest information from just-released American Community Survey shows many gaps still not overcome.
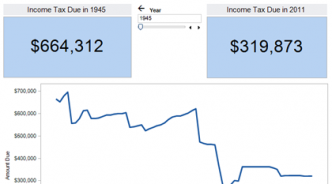
Data from W-2's allow closer look at income higher on the wage scale
"Net compensation" data allow for examination of wage income as high as the "$50 million and up" category.
Insurance execs are more valuable than doctors, aren't they?
They certainly make much more money, and the gap has been growing over time.
Large racial gaps in median income on city level
Last week: state-by-state gaps. This week: Whites, Asians in largest U.S. cities still have far higher incomes than African Americans, Latinos.