Map & Data Resources |
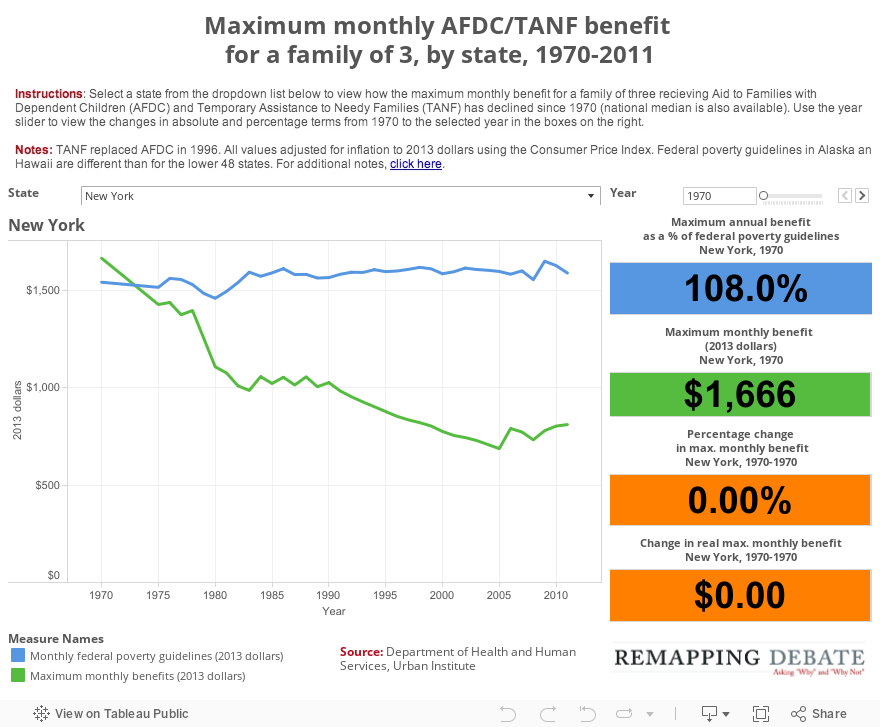
On this page, you can select a state (or the District of Columbia) to view the decline in the real value, in 2013 dollars, of the maximum AFDC/TANF benefit for a family of three from 1970 to 2011 (the national median, which includes the District of Columbia, is also available). You can also select a year on the right hand side of the visualization to see how much benefits declined from 1970 to the selected year.
In New York, for example, the maximum monthly benefit for a family of three in 1970 was $1,666 in today’s dollars, representing 108 percent of the federal poverty guidelines. In 2011, by contrast, that value had fallen by more than half, to $812, representing only 51 percent of the poverty guidelines.
Pages
- « first
- ‹ previous
- 1
- 2
- 3