May 8, 2013 — As we document in three new interactive visualizations, the value of public assistance benefits (first called “Aid to Families with Dependent Children,” or “AFDC,” and subsequently renamed “Temporary Assistance for Needy Families,” or “TANF”) has fallen dramatically in every state between 1970 and 2011 for families of three, both in absolute dollars and as a percentage of the federal poverty guidelines (guidelines very similar to the poverty threshold in all states except in Alaska and Hawaii).
On this page, we present a map of the United States showing the relationship between federal poverty guidelines and the maximum monthly value of AFDC/TANF benefits in each state and the District of Columbia. When you use the slider at the top of the visualization to see change over time, the scope of the cutbacks becomes starkly apparent. In 1970, for example, the maximum benefit was greater than 50 percent of the poverty guidelines in 39 jurisdictions; in 2011, only one jurisdiction (New York) was still providing maximum benefits in excess of 50 percent of the poverty guidelines.
On page two, we map the decline in the real value (in 2013 dollar terms) of the maximum AFDC/TANF benefit for families of three.
On page three, we present a chart that allows more detailed exploration of change in each jurisdiction over time.
For more information on sources and methodology, please click here.

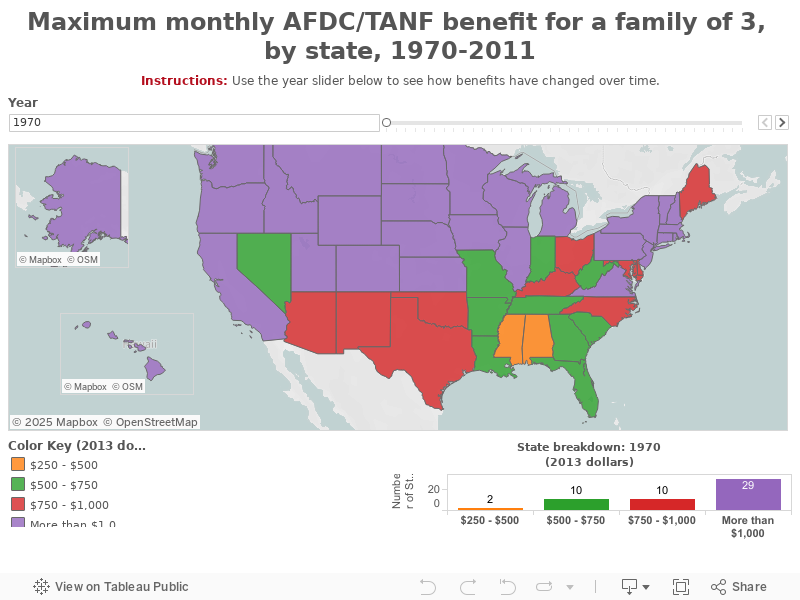
On this page, we present another map of the United States, this time color-coded by the inflation-adjusted value of the maximum monthly benefit in each state. Again, use the year slider to view different years. You will see that in 1970, the maximum monthly AFDC value was more than $1,000 in 29 jurisdictions, while in 2011 it was more than $1,000 in none. In Mississippi, the state with the lowest monthly benefit maximum, the benefit level in 1970 was $334; in 2011, it was $175.
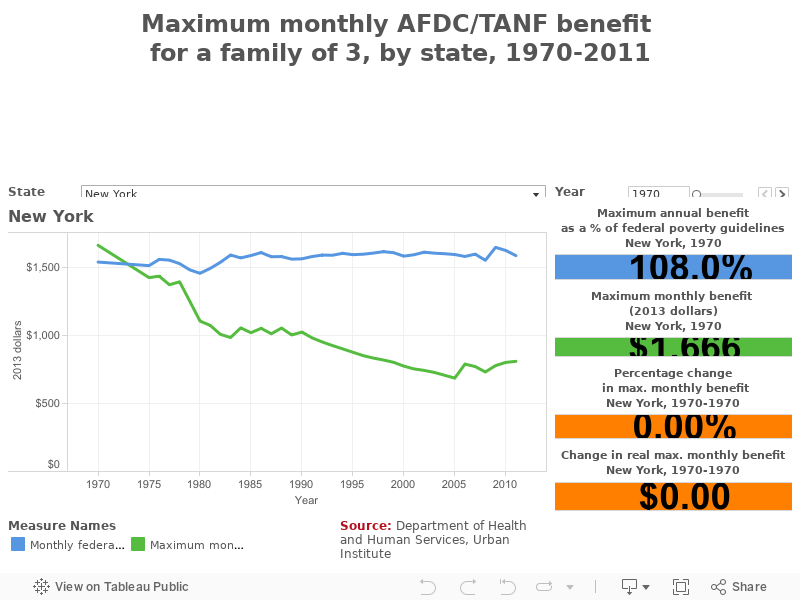
On this page, you can select a state (or the District of Columbia) to view the decline in the real value, in 2013 dollars, of the maximum AFDC/TANF benefit for a family of three from 1970 to 2011 (the national median, which includes the District of Columbia, is also available). You can also select a year on the right hand side of the visualization to see how much benefits declined from 1970 to the selected year.
In New York, for example, the maximum monthly benefit for a family of three in 1970 was $1,666 in today’s dollars, representing 108 percent of the federal poverty guidelines. In 2011, by contrast, that value had fallen by more than half, to $812, representing only 51 percent of the poverty guidelines.