Map & Data Resources
Unemployment rate more than twice its pre-recession low? For whom?
Map & Data Resources |
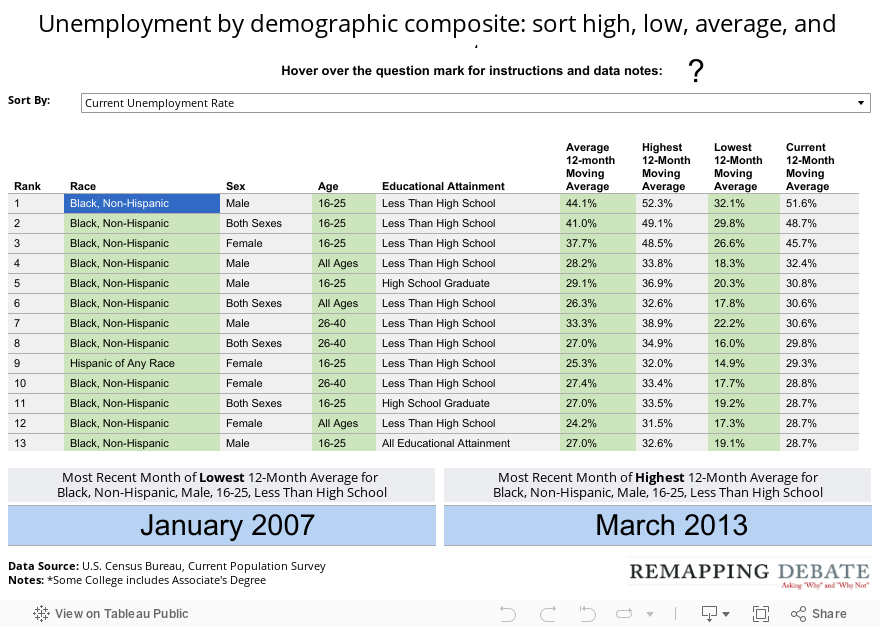
The visualization on this page is in table form and allows you to sort each of the available demographic composites by the overall average of unemployment for the entire period, the highest and lowest 12-month moving unemployment averages for the entire period, and the current 12-month moving average (May 2013 is the most recent reporting date).
Below the table, the visualization also shows what in what months the lowest and highest 12-month averages occurred for a selected composite. Simply click on the appropriate row in the table to view that information.