Sept. 7, 2011 — Remapping Debate has now completed the project it began in June to collect Fiscal Year 2011-12 data on basic state aid to public schools for K-12 education. (The U.S. Department of Education does not publish current statistics on such state-by-state aid.)
We put the Fiscal Year 2011-12 data we collected in context by comparing it to Fiscal Year 2007-2008 aid (the Fiscal Year 2011-2012 data we report are inflation-adjusted, reported in Fiscal Year 2007-2008 dollars for an apples-to-apples comparison).
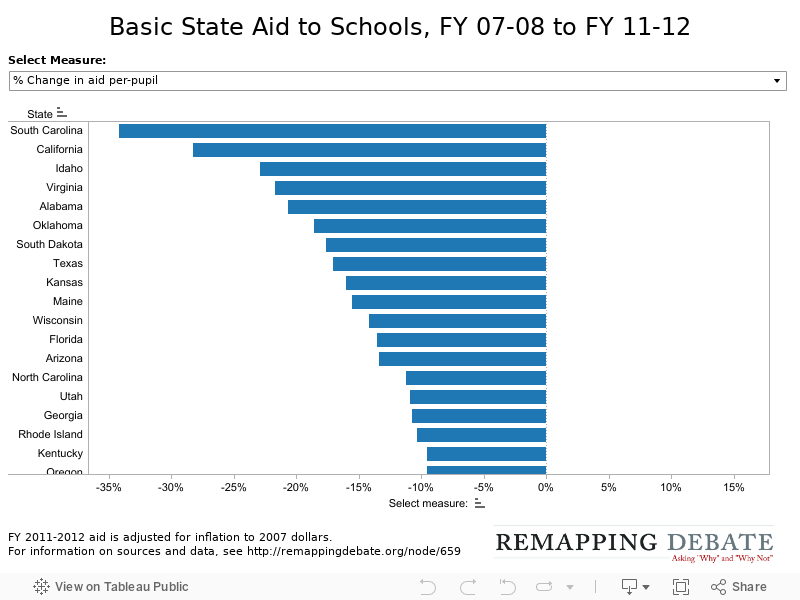
Of 49 states where we were able to obtain the necessary comparison points (New Hampshire’s shift in its funding process precludes a direct comparison), all but 10 have reduced overall aid, and all but nine have made cuts on a per-pupil basis.
South Carolina leads the race to the bottom with drops of 33 and 34 percent in overall aid and per-pupil aid, respectively. California is second, with a drop of 29 percent in overall aid and 28 percent on a per-pupil basis. 19 states had drops of at least 10 percent in overall aid, per-pupil aid, or both.
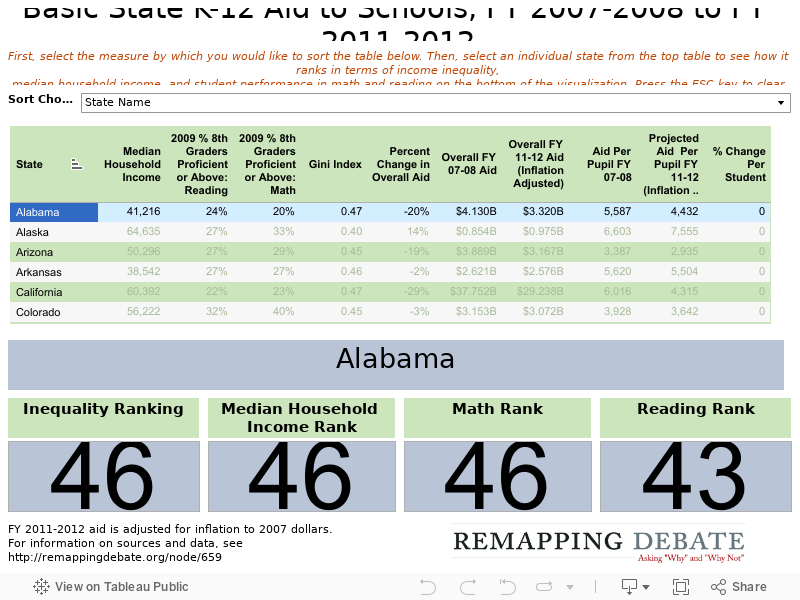
The table on the next page provides additional information: data and ranking in terms of median household income, eighth-grade reading and math achievement, and state-level income inequality (measured by the GINI index). It reports the changes in aid on a percentage basis depicted in the chart below, and the numbers behind the chart as well.
Of the 10 states with the lowest per-pupil aid, Pennsylvania performed best based on reading and math rank (5th and 10th, respectively), but had an inequality rank of 32. South Dakota had a reading and math ranks of 9th and 8th respectively, but had an inequality rank of 24.
Of the 10 wealthiest states for which data are available, Connecticut, Massachusetts, Minnesota, and New Jersey all performed well as reflected in reading and math ranks, with Minnesota having the least inequality of the group (ranking 15th in the country), and reading and math ranks of 7th and 2nd, respectively. Minnesota’s projected per-pupil aid ranks 6th highest in the country.
Please review our notes on sources and methodology, which include an explanation of what aid is and is not being included to facilitate state-to-state comparison.
Please review our notes on sources and methodology, which include an explanation of what aid is and is not being included to facilitate state-to-state comparison.