May 18, 2011 — For many years now, the National Center for Education Statistics has overseen national measures of educational attainment in civics, mathematics, reading, science, and United States history. Remapping Debate’s new tools attempt to allow for new ways to put those data in context. However you look, the percentage of students who performed at an “advanced” level is soberingly low.
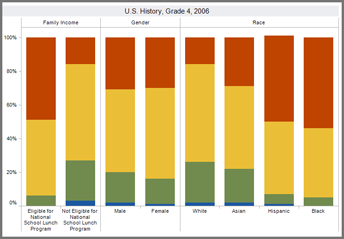
Our basic tool permits viewers to examine results for pre-determined categories of test takers by race or by economic status or by gender. We have these data available for the five subjects identified above for all years of test administration.
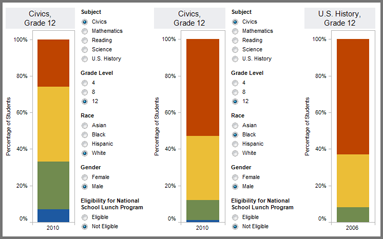
Our custom tool for resolutions of at least 1024 x 768 allows for greater selectivity, allowing users to move across more boundaries at a single time. For example, users can mix and match subjects, grade levels, or demographic subcategories (like white females who are eligible for reduced-price lunches).
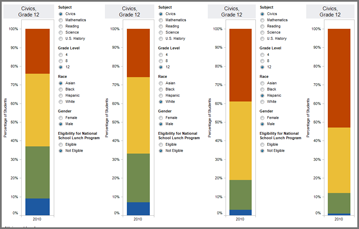
Our custom tool for resolutions of at least 1600 x 1200 performs the same task as the standard resolution version, but allows for four simultaneous comparisons rather than three.
Note 1: The custom tools only provide information for the most recent administration of each of the subject matter tests, but historical testing data for these data visualizations will be available next week.
Note 2: Not all subject matter tests are administered in the same year. As such, when comparing across subject matter, be aware that the test administration years (shown at the bottom of each results bar) may differ from one another.