April 20, 2011 — In the wake of Census 2010, media attention has focused on the slow trend towards less segregation for African-Americans that has continued in the last 10 years. But demographic experts agree that segregation in the United States is still alive and well. And Remapping Debate’s new maps provide vivid proof that a substantial increase in diversity in the nation overall is not mirrored by the demographics of the segregated neighborhoods in which most Americans live.
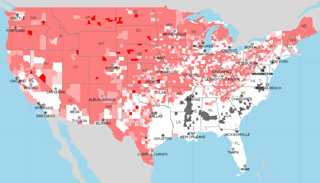
The maps — created for Remapping Debate by Social Explorer — are color-coded to highlight areas of very low and very high minority concentration.
Users can zoom down to the Census Block group level — the unit of geography intermediate between the larger “Census Tract” and the smaller “Census Block.”
The zooming function permits the user to experience the way that high levels of segregation that are cloaked at large geographic levels are revealed as one gets to the neighborhood level.
The tool even permits the user to enter an individual address and have the map zoom in accordingly. When one highlights the information icon and then clicks on the map, the selected demographic information for the selected area is displayed.
Segregation still high
Each of the demographers to whom Remapping Debate spoke was careful to note that no single measure of segregation is able to provide a full picture of the phenomenon. Nevertheless, each relies, in some part, on the most commonly cited measure of segregation: the “dissimilarity index.” That index measures the percentage of a group that would need to move for the group to be evenly distributed throughout the geographic area in question. The index can range from zero to 100; the common rule-of-thumb — which demographers all caution should not be taken as a hard and fast rule — is that a dissimilarity index of 60 or above reflects a high level of segregation.
Remapping Debate, based on 2000 and 2010 census data available from the US 2010 project of the Initiative in Spatial Structures in the Social Sciences at Brown University and from the Population Studies Center at the University of Michigan, examined metropolitan areas that had African-American populations of at least 5.0 percent and overall population of 500,000 or more.
Instructions for using the maps
- When you go to the maps, use the second drop down menu on the right to choose among 3 maps.
- Tip: Use the “find” tool above the map to navigate to specific address, city, zip code, county, or other place of interest.
- Zooming and panning tools are available above the map.
- Note that it takes several clicks to go from the national level to the census block group level.
- Tip: Holding down left mouse button will allow you to draw desired geographical area.
- Tip: once geographical area selected, you can toggle among the maps and will stay at the chosen geography.
- Highlight the information icon and then click on the map: the selected demographic information for the selected area is displayed.
- Note: “report” functionality is not available.
In 2000, approximately 69 percent of individuals who lived in the large metro areas described were living in areas of high segregation between non-Latino African-Americans and non-Latino whites, as measured by a dissimilarity index of 60 or above. In 2010, that percentage was still approximately 65 percent.
That’s more than 115 million of the fewer than 180 million people who now live in those large metropolitan areas.
William H. Frey is a demographer and sociologist and a Senior Fellow with the Metropolitan Policy Program at the Brookings Institution. Frey agreed that Remapping Debate’s 2010 finding was significant: “it tells you that there’s a pretty high level of segregation.” Frey wanted to be sure that people understood that segregation exists at distinctly different intensities in different metropolitan areas, but said as well that the 2010 census provides a snapshot that shows that “the United States is still a residentially segregated society…there’s no question about that.”
Older areas stuck with segregation?
In his discussion with Remapping Debate, Frey initially made the provocative point that “areas that aren’t growing a lot are stuck with the segregation patterns they’ve had for a long time, and that areas that are growing more rapidly have an opportunity to change that segregation going on.”
He explained that rapid change in segregation levels could occur only if “everybody stands up and moves at the same time.” In contrast, Frey asserted, “what we know about migration in the United States is that, for the most part, it’s only young people who move, and although we may have about 12 percent of the population moving each year it’s not a different 12 percent from one year to the next, it’s the same young people moving over and over again to some degree.”
But is it really the case, Remapping Debate asked, that, in the context of the many older Northeastern metropolitan areas that are not experiencing growth, people would necessarily be forced to remain either in a highly white or a highly black census tract? Couldn’t moves within a city or metro area reduce segregation?
“That’s true,” Frey acknowledged. “In fact, in the very high segregation areas…what happens is that neighborhoods get ensconced not only in respect to race, but also the unequal resources that go along with those segregation patterns.” These phenomena, he concluded, just get “kind of ossified over time.”
The average American lives in a neighborhood that looks a lot like himself
John Logan is a demographer and a professor of sociology at Brown University who runs the US 2010 project. Logan said that the Census 2010 data showed him that the average American still “lives in a neighborhood that’s a lot like himself or herself in terms of race, and that blacks, whites, Hispanics, and Asians live in very different kinds of neighborhoods in this respect.”
Logan believes that there is a consensus among demographers that segregation levels do remain high. Residential patterns, he said, are “very different from reflecting in neighborhoods the diversity of the nation or the metropolis. So, I don’t think anybody who has studied the situation, at least I can’t think of anybody who’s said, ‘well things are ok now…we’ve passed [a] point where things are fine.’”
What about segregation for Latinos and for non-Latino Asians, two groups that are growing quickly in the United States. Logan’s assessment — particularly for areas that historically have had relatively large Latino or Asian populations — is that there hasn’t been much change over the course of the last 30 years. “The thing that’s changing is that the groups are getting much larger,” Logan said. “In the neighborhoods where they’re over-represented they’re becoming more and more ethnically homogeneous.”
Better than a “hideous past,” but not where we want to be
John Iceland is a professor of sociology and demography at Penn State, and is the co-author of “Racial and Ethnic Residential Segregation in the United States, 1980-2000.”
His characterization of segregation for African-Americans: it’s declined “from being extraordinarily high to [being] pretty high.”
Comparing the current state of residential patterns to what Iceland called “our hideous history of American apartheid,” he said that “things are not as rigid as they used to be.”
Remapping Debate asked Iceland to give his reaction to anyone who believes that the trend data emerging from Census 2010 suggests that segregation is no longer a problem. “To say that race no longer shapes social relations, or where people live, or who their friends are,” Iceland replied, “that is certainly not the case, and we have a lot of data to show that is simply not the case. He added, “I would say that race still clearly plays an important role in shaping residential patterns in the United States.”
Remapping Debate thanks Ahmed Lacevic, the Vice-President and Chief Software Engineer of Social Explorer, for his assistance.