May 21, 2025 — The reigning assumption in Washington today seems to be that the federal non-military workforce has become bloated, unwieldy, and inefficient.
While it’s true that the size of the civilian workforce — in absolute terms — has increased steadily over many decades, looking at the size of the federal workforce without taking population size into account is very misleading. While 110 workers are more than 100 workers, if those 110 workers are serving 5,000 citizens instead of 1,000 citizens, the effective size of government employment has declined. Indeed, even before any cuts imposed unilaterally by the Trump administration this year (or to be imposed by budget legislation currently pending in Congress), overall executive branch civilian employment as adjusted for population is materially down from its peak.
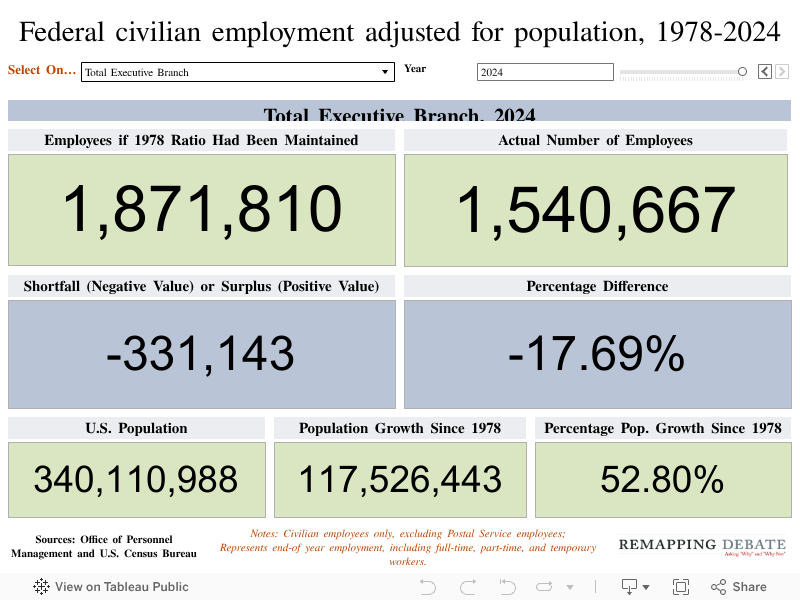
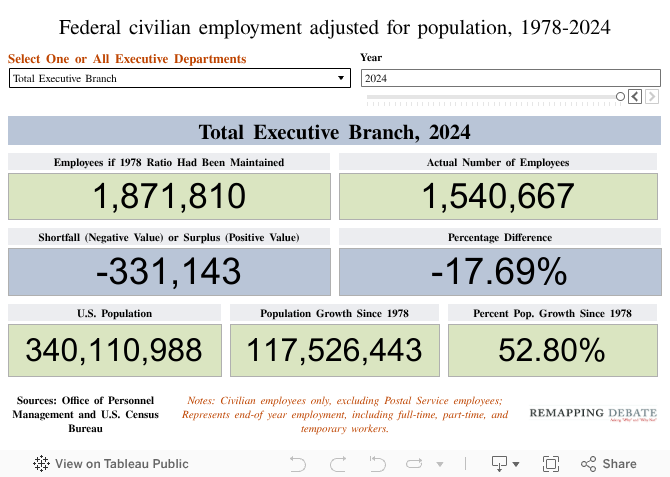
To do this analysis, we first compared federal executive branch civilian employment in each year after the end of World War II with the population for the United States in that year. Highest employment in relation to population occurs when there are most federal workers for each American. After calculating the population to employment ratio for federal executive branch civilian employment as a whole, we saw that the employment peak in these terms was 1978. We then also calculated the population to employment ratio for that year for each agency or agency grouping where data were available from the Office of Personnel Management (OPM).
OPM assigns employees to agencies or agency groups so that there is comparability over time (that way, for example, civilian employees with the functions now performed by the Department of Homeland Security are reported in the Homeland Security category even prior to the creation of that department).
We then asked the questions: if the ratio had been maintained, what would the number of employees have been in each year since 1978, and how does that alternative path compare to the actual personnel patterns that transpired? In the first visualization below, the drop-down window allows you to select total federal civilian employment or select a particular agency or agency grouping. The slider allows you to observe change over time.
Note: the visualization is not designed to capture the phenomenon of increasing federal spending on contractors to do work that would otherwise be performed by federal civilian employees. Additional note.
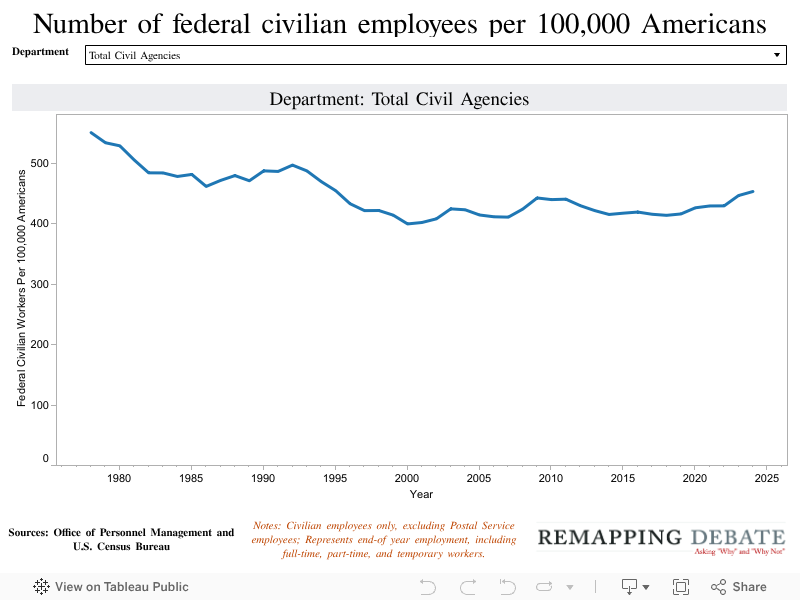
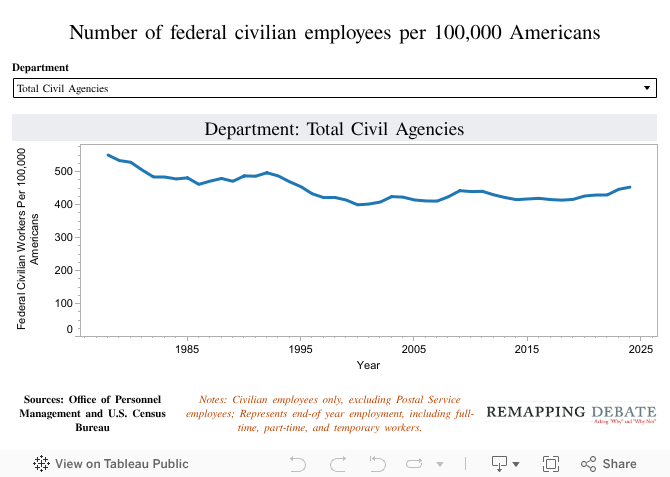
This second visualization below shows the number of federal works in each Department per 100,000 Americans over the same time period as the first.
It turns out that overall executive branch federal civilian employment is effectively down quite substantially from the 1978 peak as defined above (550 employees per 100,000 Americans). In terms of the categories of agencies delineated by OPM, all are likewise substantially down, with the exception of the Department of Homeland Security and the Department of Justice. Employment is not, however, at its lowest point: 399 employees per 100,000 Americans at the end of the Clinton Administration in 2000.
Levels at the end of each administration in the period studied are here.
Looking at change in recent years, we found that the majority of that increase is related to specific factors at a small number of agencies.
The primary driver (accounting for fully 50% of the increase in total civilian workforce since 2018) was the Department of Veterans Affairs, and specifically the Veterans Administration and Veterans Benefits Administration housed within it. Employment at these agencies has increased significantly over the last two decades, in part due to the increasing number of Veterans eligible for benefits following the wars in Iraq and Afghanistan. Another factor that has contributed to employment at the VA in recent years is the passage of the Promise to Address Comprehensive Toxics (PACT) Act of 2022, which significantly expanded the eligibility for VA services driving the hiring push in recent years.
Employment has also risen significantly at the Treasury Department since 2018, driven almost entirely by hiring at the Internal Revenue Service. The agency received significant funding in the 2022 Inflation Adjustment Act. Despite these recent gains, civilian employment remains broadly down from its 1978 peak when adjusted for population.
Note: the visualization is not designed to capture the phenomenon of increasing federal spending on contractors to do work that would otherwise be performed by federal civilian employees. Additional note.