Jan. 30, 2013 — Though the Supreme Court’s landmark decision in Roe v. Wade affirming a woman’s right to choose to have an abortion remains the law of the land, states enacted more restrictions on abortion in 2011 and 2012 than in any other years since Roe was decided four decades ago.
Updating our work from 2011, Remapping Debate has collected information from various sources on all of the many restrictions on abortion that have been legislated by individual states. We classified those restrictions into ten categories, ranging from state-imposed limitations on the ability of private insurance plans to cover abortions to requirements that the parents of minors be involved in their daughter’s decision to have an abortion. New to this update are a count of near-total bans on abortion that would become operative if Roe were overturned, as well as a count of the limitations on public financing of abortions.
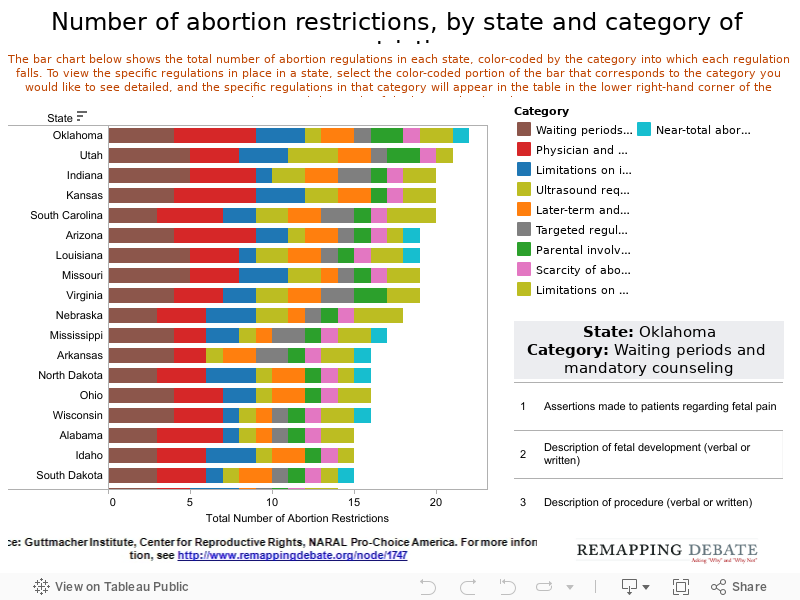
We visualized that data in three graphs. The resulting picture is of an increasingly burdensome set of restrictions on access in numerous states. There may a nationally-guaranteed right to abortion, but real access is strongly influenced by the state where a woman happens to live. Oklahoma, for example, has 22 separate provisions restricting women’s access to abortion, while Oregon has none.
The primary source of our data is the Guttmacher Institute, a research group in Washington, D.C. and New York. According to Elizabeth Nash, the state issues manager there, while states in the Midwest and South have long had many laws limiting abortion access, the last decade has seen an explosion in such restrictions even in states that were previously supportive of abortion rights, such as Arizona. According to her research, one-third of women in 2000 lived in a state that was openly hostile to abortion. By 2011, that figure had jumped to half.
“What we’ve seen over time is a wholesale change in the abortion landscape,” Nash said. “Particularly in the last two years, we have just seen a tidal wave of restrictions rolling across the country.”
According to Nash, 92 new restrictions were enacted in 2011 and 43 were enacted in 2012, the highest and second-highest number of annual restrictions ever.
In particular, Nash said, many states have recently passed laws requiring physicians to be in the physical presence of the patient when prescribing mifespristone — a pharmaceutical drug that induces an abortion at a very early stage of pregnancy — effectively prohibiting doctors from prescribing the medication over the telephone and reducing access to abortion in rural areas. Onerous regulatory restrictions placed specifically on abortion providers (TRAP laws), bans on the coverage of abortion by health insurance policies that will be offered through state exchanges beginning next year as part of the Affordable Care Act, and laws requiring abortion providers to perform ultrasounds and show the image of the fetus to their patients before the procedure have also been common in the last two years, Nash said.
“None of these restrictions are based on scientific evidence concerning what is best for the health of the woman,” Nash said. “The kinds of restrictions we see being passed are meant to make it more difficult for providers to perform abortions and more emotionally difficult for women to choose them.”
The chart below is organized simply by the total number of abortion restrictions in a state (coded by category, with more than one restrictive provision possible in each category).
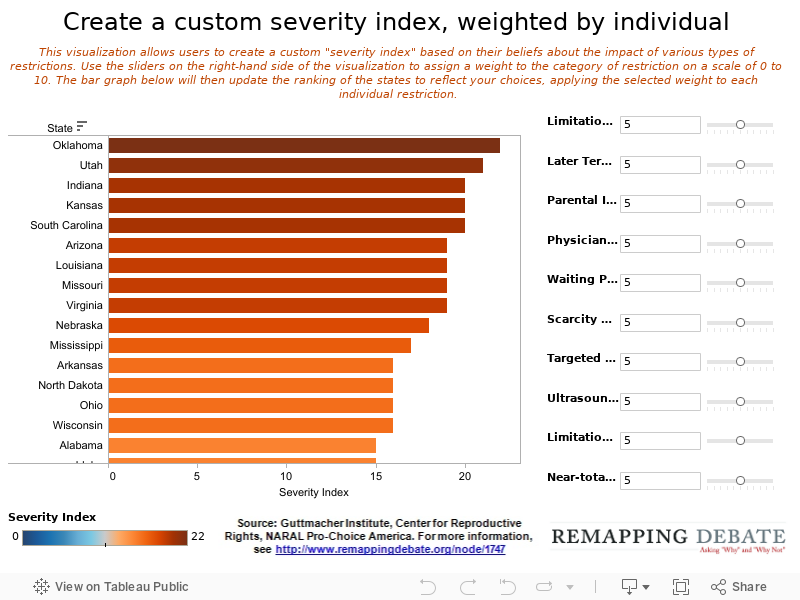
On page 2, we present a tool by which the user can assign relative weights to the different categories of abortion restriction. Note that in this second visualization, each separate provision within a category is assigned the weight, thus potentially underweighting a category with a single, specific restriction that the user believes has significant impact.
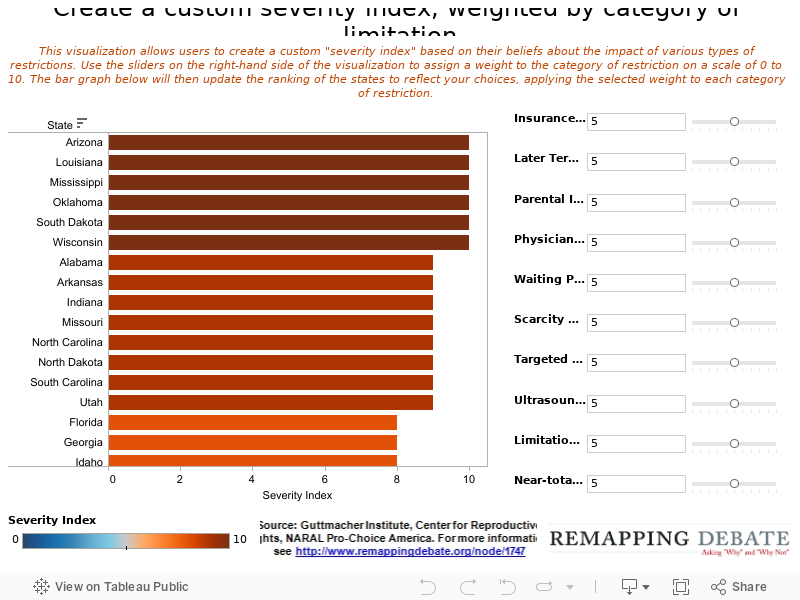
On page 3, by contrast, we present a tool by which the relative weight is assigned only to the category. Thus, in this last visualization, there is the possibility that the impact of one state that has just begun to put in place various restrictions within a category will be treated equally to a state that has numerous restrictions within that category.
Please review our other notes on sources and methodology.
Primary data gathering for the originally-published visualization was performed by Althea Webber.