More U.S. kids in poverty than people in your state?
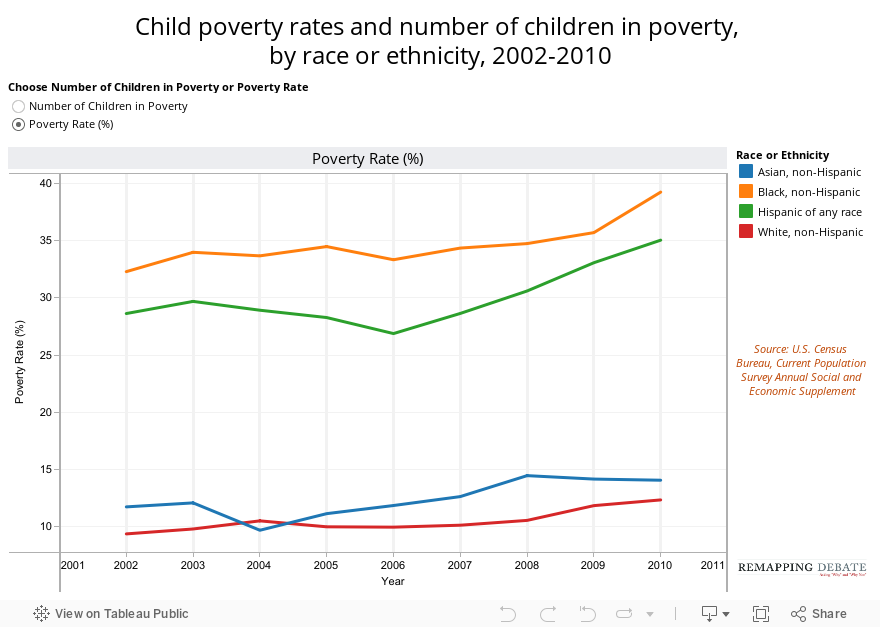
The graph below allows you to view either the number of children in poverty or the child poverty rate for selected racial and ethnic groups. For each, both number and rate has has risen since 2002. The child poverty rate for non-Hispanic blacks and for Hispanics has been dramatically higher than for whites in 2002, but the gap has grown even larger in the ensuing years.
Note that data are presented for non-Hispanic blacks to avoid the problem of double-counting. (Presenting data for all blacks means that Hispanic blacks are counted once in the racial category “black” and once in the ethnic or national origin category “Hispanic.”) As it happens, the difference in this case is marginal in terms of poverty rate (in raw numbers, the difference for 2010 is 273,000).
A recent report from Pew Hispanic Center, which does count all blacks, has a wealth of additional child poverty data and analysis. It is entitled The Toll of the Great Recession.